Prometheus 监控注册 Nacos 注册的服务
Prometheus 监控注册 Nacos 注册的服务
Prometheus官方提供Consul为注册中心的配置方式且只支持Consul的接口,配置后可自动获取Consul中所有实例的信息并进行监控,这里使用 Nacos Consul Adapter 来让 Nacos 伪装成 Consul
在 Spring Cloud Gateway 引入jar包
可以是服务中任意的节点,在Spring Cloud Gateway中引入jar包的原因是它基于Reactor,如果不是使用Spring WebFlux则还需要引入额外的包。
<dependency>
    <groupId>io.github.chen-gliu</groupId>
    <artifactId>nacos-consul-adapter</artifactId>
    <version>version</version>
</dependency>
如果拉取不到包,可以在setting文件中添加如下配置:
<mirror>
	<id>mvnrepository</id>
	<mirrorOf>*</mirrorOf>
	<name>仓库</name>
	<url>https://repo1.maven.org/maven2</url>
</mirror>
修改应用的依赖及配置
在 pom.xml 文件中添加相关的 Maven 依赖项,视情况调整相应的版本
<dependency>
    <groupId>io.prometheus</groupId>
    <artifactId>simpleclient</artifactId>
    <version>0.9.0</version>
</dependency>
<dependency>
   <groupId>io.micrometer</groupId>
   <artifactId>micrometer-registry-prometheus</artifactId>
   <version>1.5.1</version>
</dependency>
修改代码,暴露指标接口
在项目启动时,添加相应的监控配置,同时 micrometer 也提供了部分常用的监控数据采集,具体在 io.micrometer.core.instrument.binder 包下,可以按实际情况添加。
姿势一:
public class Application {
    // 作为全局变量,可以在自定义监控中使用
    public static final PrometheusMeterRegistry registry = new PrometheusMeterRegistry(PrometheusConfig.DEFAULT);
    static {
        // 添加 Prometheus 全局 Label,建议加一上对应的应用名
        registry.config().commonTags("application", "java-demo");
    }

    public static void main(String[] args) throws Exception {
        // 添加 JVM 监控
        new ClassLoaderMetrics().bindTo(registry);
        new JvmMemoryMetrics().bindTo(registry);
        new JvmGcMetrics().bindTo(registry);
        new ProcessorMetrics().bindTo(registry);
        new JvmThreadMetrics().bindTo(registry);
        new UptimeMetrics().bindTo(registry);
        new FileDescriptorMetrics().bindTo(registry);
        System.gc(); // Test GC
        try {
            // 暴露 Prometheus HTTP 服务,如果已经有,可以使用已有的 HTTP Server
            HttpServer server = HttpServer.create(new InetSocketAddress(8080), 0);
            server.createContext("/metrics", httpExchange -> {
                String response = registry.scrape();
                httpExchange.sendResponseHeaders(200, response.getBytes().length);
                try (OutputStream os = httpExchange.getResponseBody()) {
                    os.write(response.getBytes());
                }
            });

            new Thread(server::start).start();
        } catch (IOException e) {
            throw new RuntimeException(e);
        }
    }
}
由于 JVM GC Pause 监控是通过 GarbageCollector Notification 机制实现,因此只有发生 GC 之后才有监控数据。上述示例为了测试更直观,主动调用了
System.gc()。通过
http://localhost:8080/metrics访问到 Prometheus 协议的指标数据。
姿势二
@Bean
    MeterRegistryCustomizer<MeterRegistry> configurer(
            @Value("${spring.application.name}") String applicationName) {
        return (registry) -> registry.config().commonTags("application", applicationName);
    }
在项目启动类加上这个bean配置之后,别忘记在配置文件加上management.endpoints.web.exposure.include=*这些配置来开启 Actuator 服务,因为Spring Boot Actuator 会自动配置一个 URL 为 /actuator/Prometheus 的 HTTP 服务来供 Prometheus 抓取数据,不过默认该服务是关闭的,该配置将打开所有的 Actuator 服务
完成之后,我们再启动服务,然后在浏览器访问
http://192.168.0.4:6601/actuator/prometheus,就可以看到服务的一系列不同类型metrics 信息例如 http_server_requests_seconds_count、jvm_threads_states_threads、jvm_classes_loaded_classes、jvm_memory_max_bytes、jvm_gc_pause_seconds summary、jvm_gc_memory_promoted_bytes_total counter 等等。
Prometheus 配置
K8s 容器版
apiVersion: monitoring.coreos.com/v1
kind: PodMonitor
metadata:
  name: java-demo
  namespace: cm-prometheus
spec:
  namespaceSelector:
    matchNames:
    - java-demo
  podMetricsEndpoints:
  - interval: 30s
    path: /metrics
    port: metric-port
  selector:
    matchLabels:
      k8s-app: java-demo
二进制版
- job_name: nacos-prometheus
   scrape_interval: 2s
   metrics_path: '/actuator/prometheus'
   static_configs:
   consul_sd_configs:
   - server: '192.168.0.4:18016'
     services: []

# 注意:-targets: 后面是引入了nacos-consul-adapter.jar包的实例IP+端口,记得换成自己的实例IP和端口。如图:
# 这个配置表示:prometheus每隔2秒钟从http://192.168.0.4:18016/actuator/prometheus这个url拉取指标数据
在 Prometheus 验证监控服务
# 重启 prometheus 容器
访问http://192.168.0.4:9090/targets

# 通过在 graph 关键字搜索一些统计数据
jvm_threads_states_threads
配置 Grafana 并展示监控界面
此处使用模版ID:10280
还有很多不错的模版,比如说:4701,14370,8878...
可以参考:https://grafana.com/grafana/dashboards/
应用概况
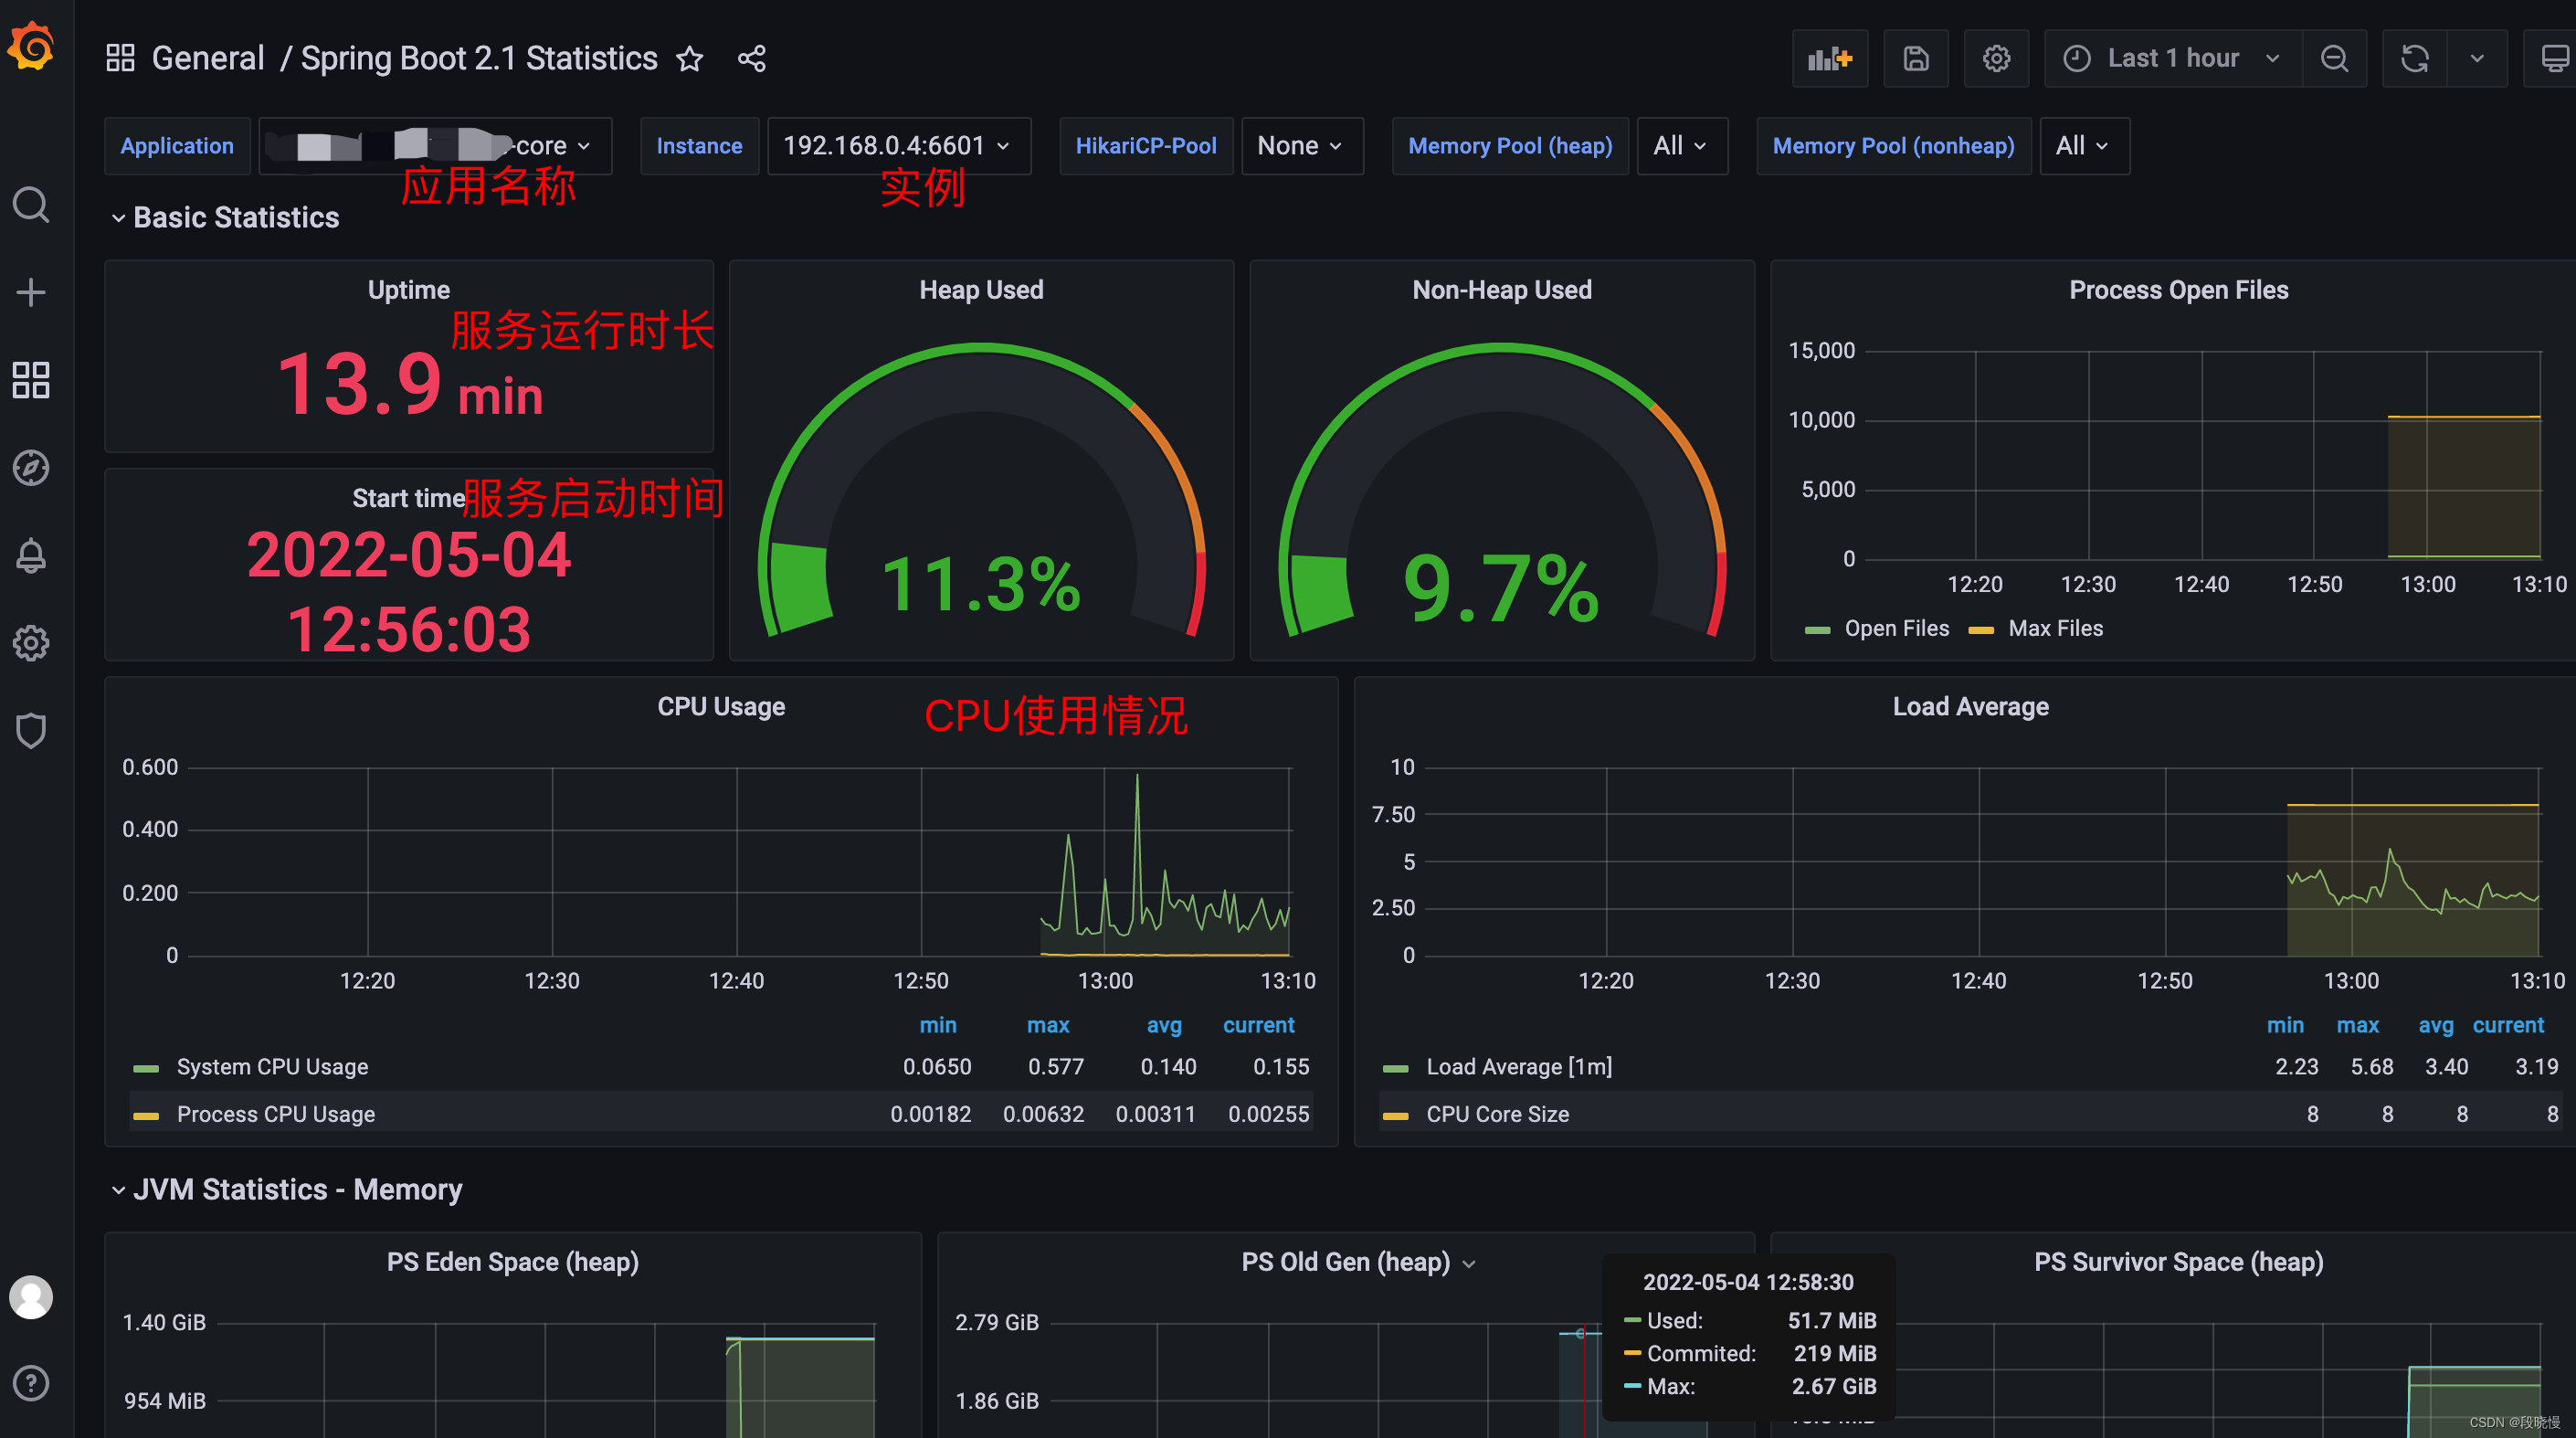
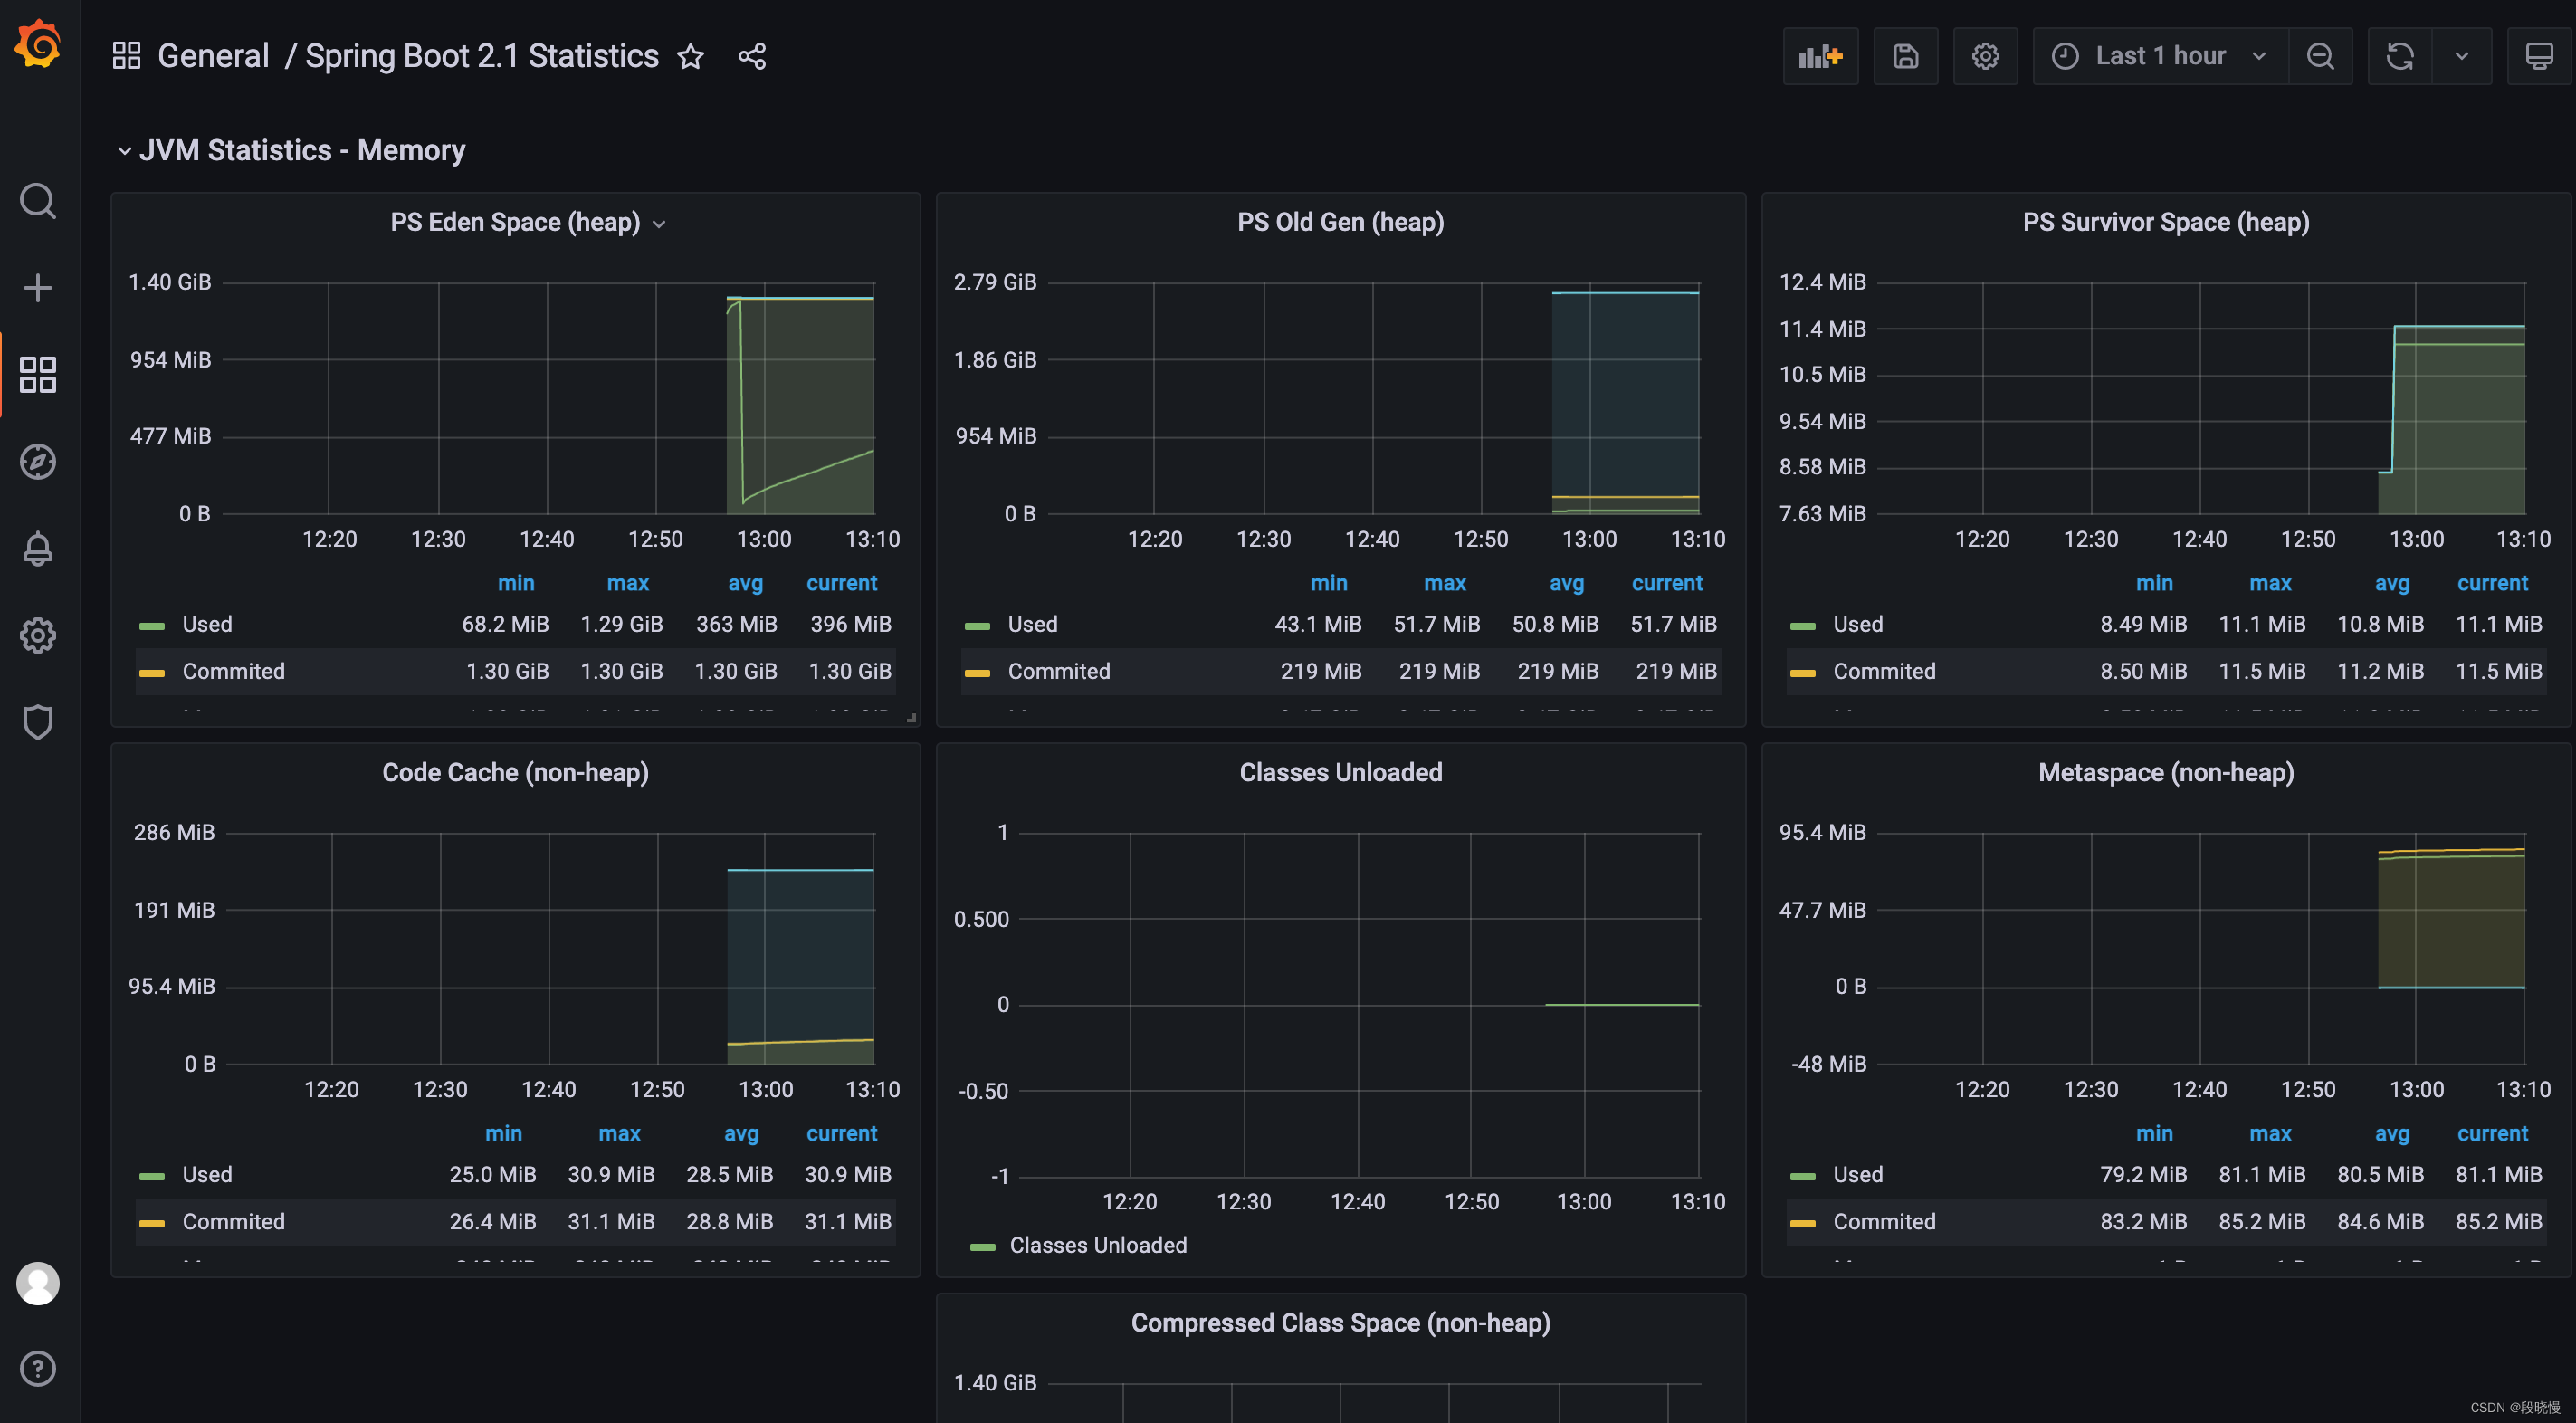
JVM 相关的监控数据
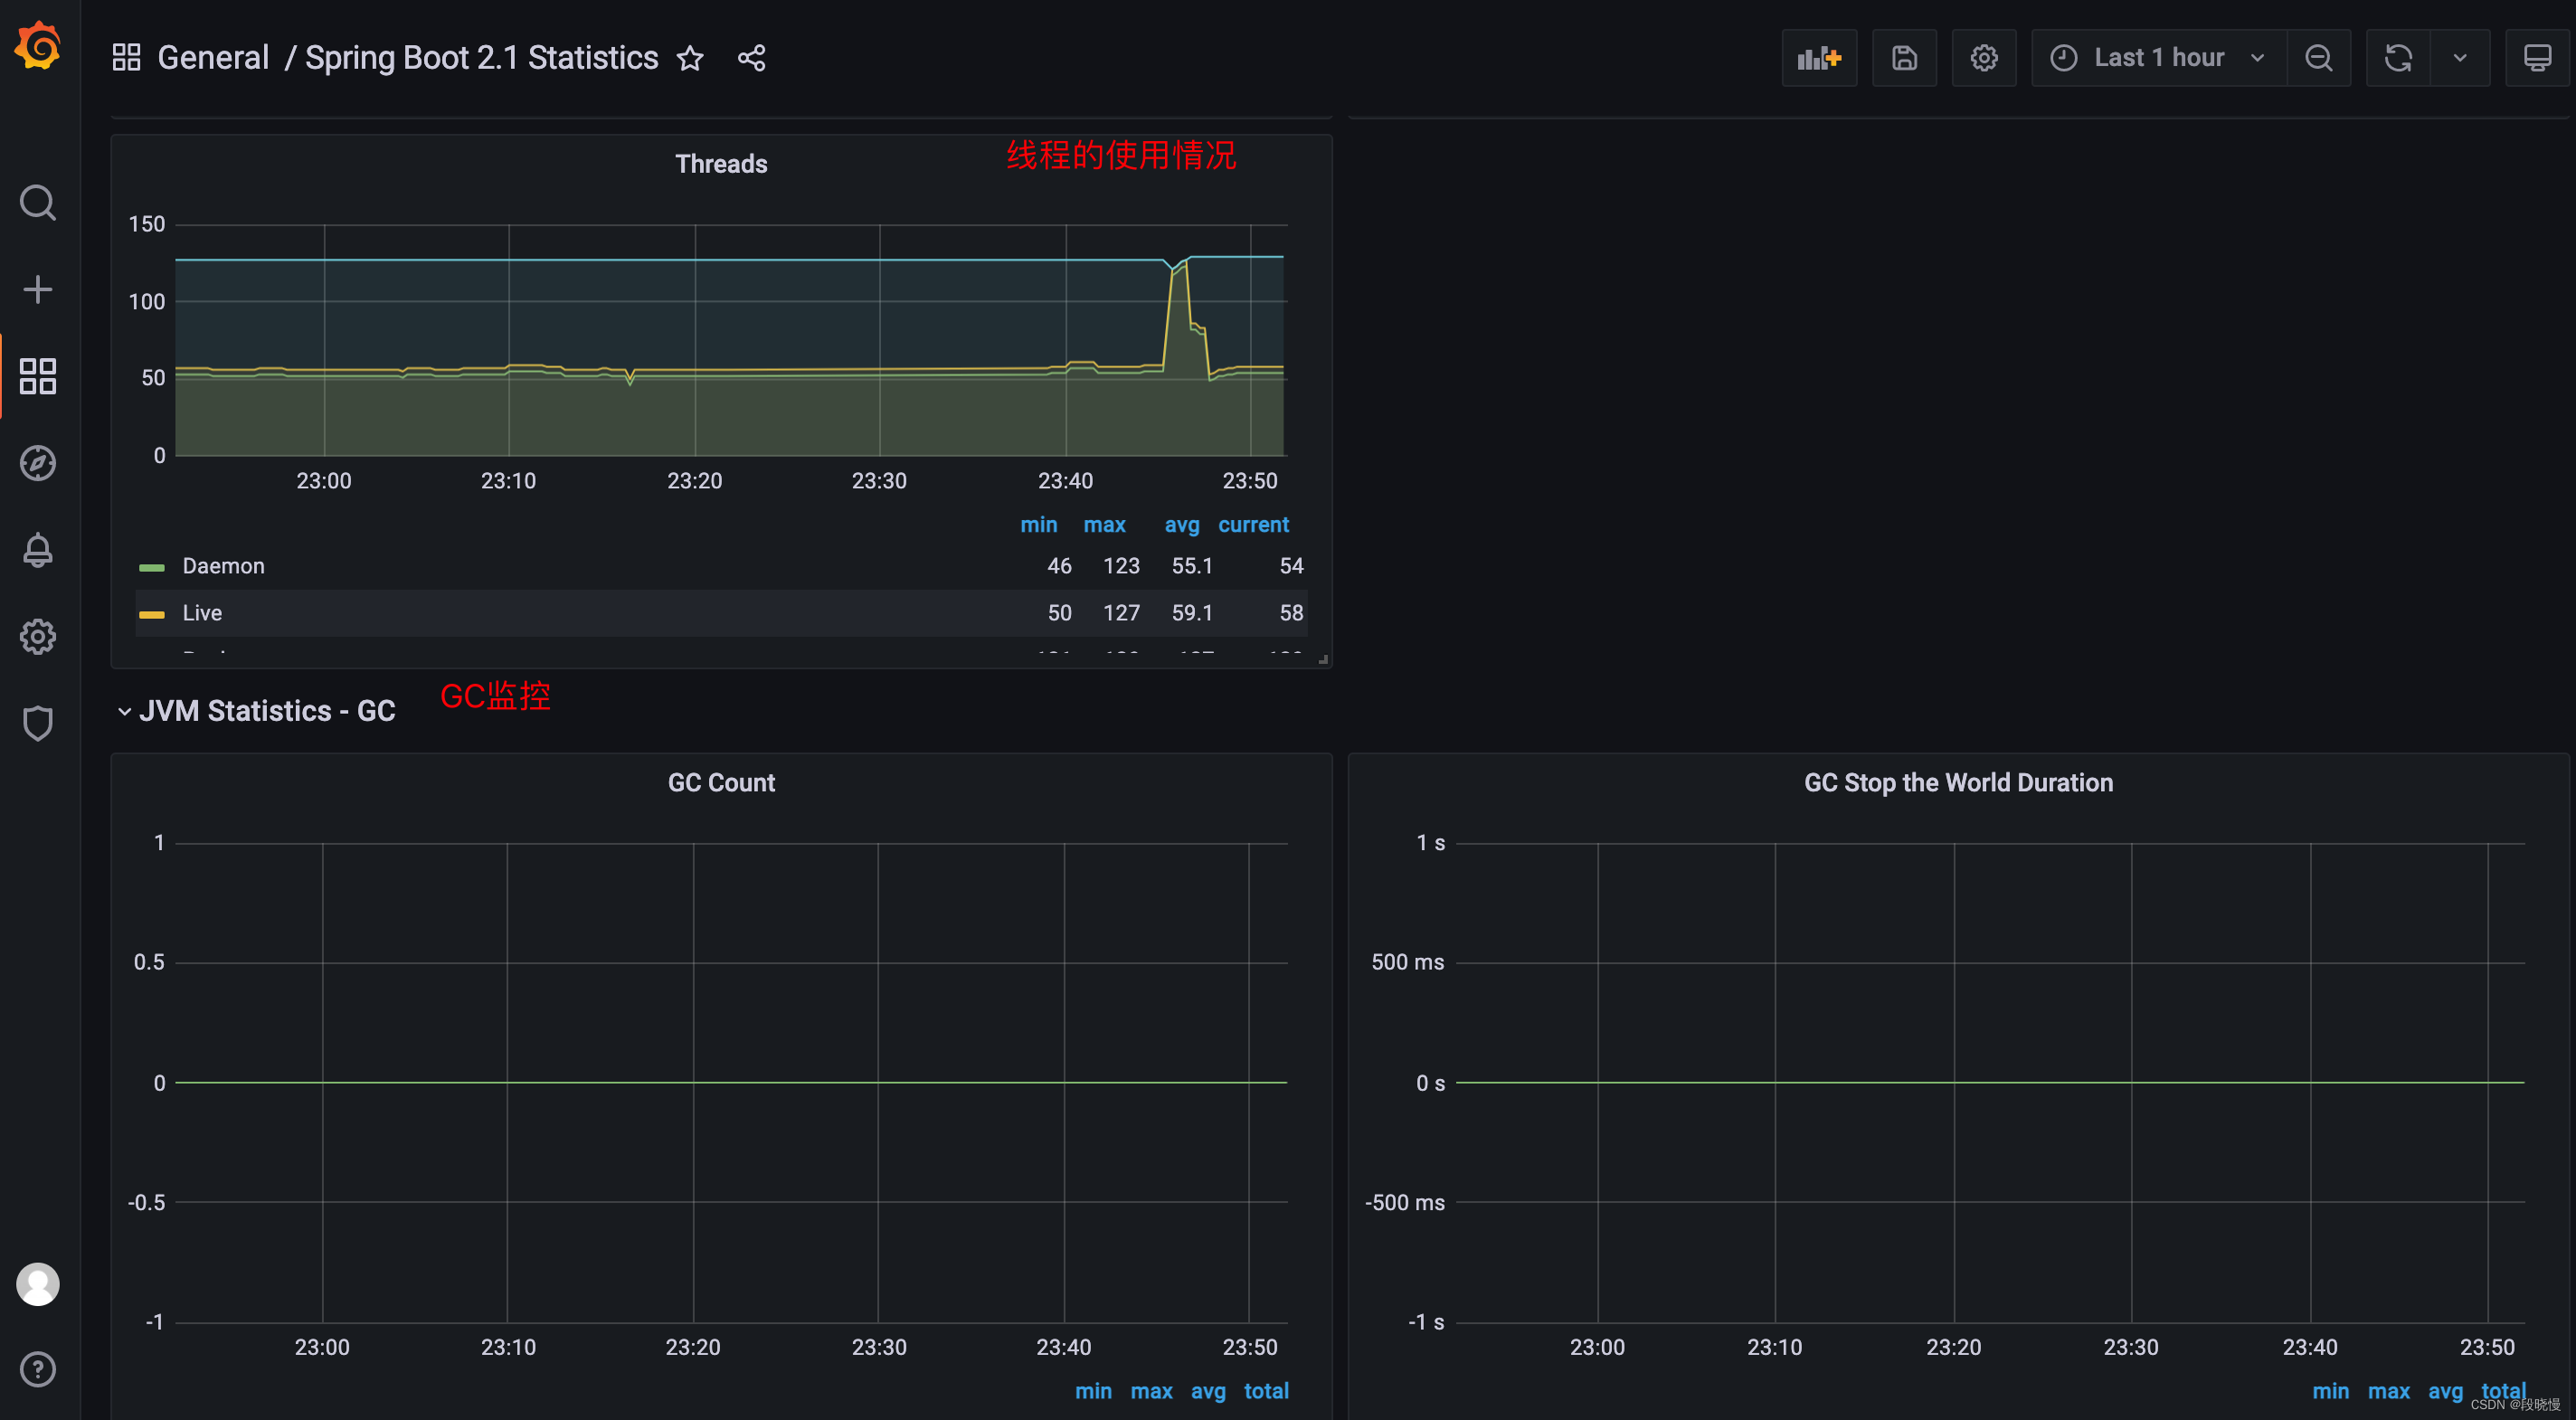
GC 情况
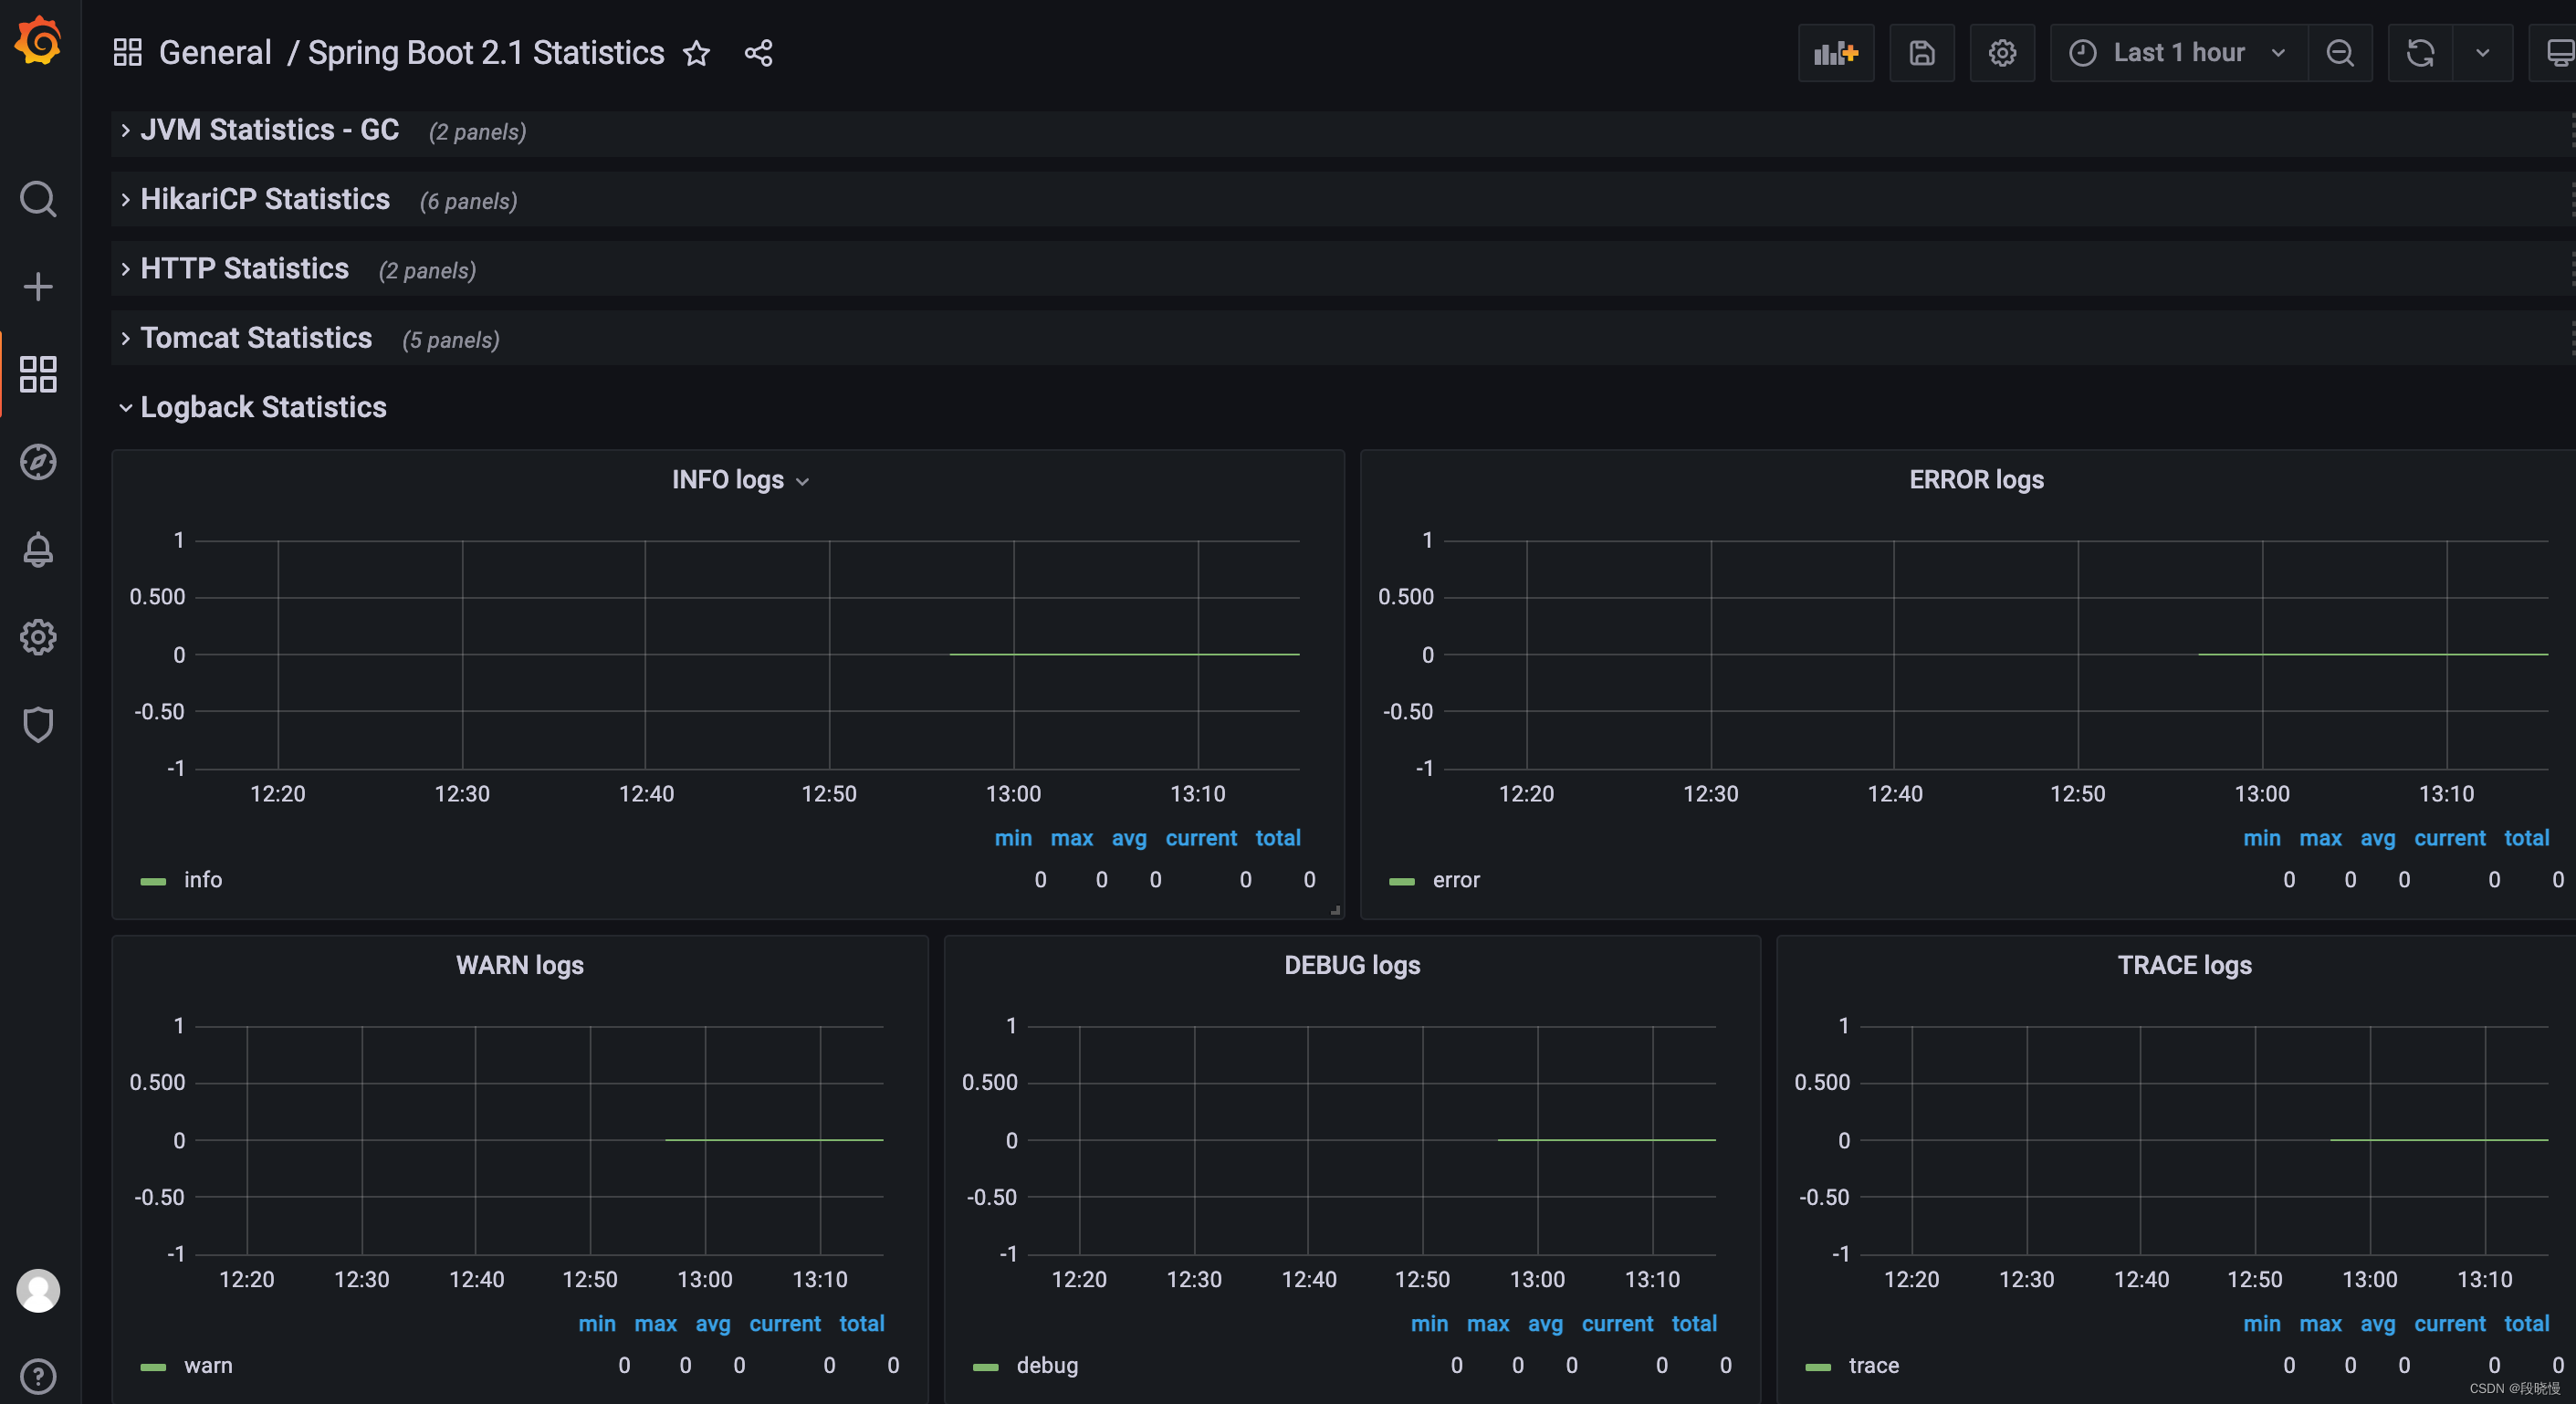
日志统计分析数据
自定义监控指标并展示在 Grafana
虽然 Spring-boot-actuator 集成了 Micrometer 来提供的默认监控项,覆盖 JVM 各个层间的监控,配合 Grafana Dashboard 模板基本可以满足我们日常对 Java 应用的监控,当然,它也支持自定义监控指标,实现各个方面的监控,例如统计访问某一个 API 接口的请求数,统计实时在线人数、统计实时接口响应时间等功能,而这些都可以通过使用 Micrometer 来实现
不对针对于接口的请求数和一些接口延迟,也可以使用 APM 来针对去做监控
举个例子:
监控所有API请求次数
监控请求次数可以使用 Counter 计数器来处理,为了测试,我们就直接在 Controller 类中进行累计,项目中,可以使用一个 AOP 切面,通过切面注入可以做到统计所有请求记录,代码:
@RestController
@RequestMapping("/gateway/metrics")
public class GrafanaTestController {
    @Autowired
    private MeterRegistry meterRegistry;
    private Counter counter;

    @PostConstruct
    public void init() {
        Tags tags = Tags.of("common", "test");
        // 公共标签
        meterRegistry.config().commonTags(tags);
        counter = Counter.builder("metrics.request.common").register(meterRegistry);
    }

    /**
     * 订单请求测试
     */
    @GetMapping("/order/{appId}")
    public RestResponse<String> orderTest(@PathVariable("appId") String appId) {
        counter.increment();
        return RestResponse.ok(appId);
    }

    /**
     * 商品请求测试
     */
    @GetMapping("/product/{appId}")
    public RestResponse<String> productTest(@PathVariable("appId") String appId) {
        counter.increment();
        return RestResponse.ok(appId);
    }
}
然后分别访问接口
/order/{appId}6次,访问接口/product/{appId}6次,然后我们在 Grafana Dashboard 上添加一个新的 Panel 并添加 Query 查询,最后图形化展示出来
避免重复代码的更改操作
1.增加 MeterRegistryCustomizer 配置类,而不是在每个实例的启动类挨个配置;
@Configuration
public class MeterRegistryConfig {

@Value("${spring.application.name}")
private String applicationName;

@Bean
MeterRegistryCustomizer<MeterRegistry> metricsCommonTags() {
return registry -> registry.config().commonTags("application", applicationName);
	}
}
2.使用 nacos 的 shared-configs 启用配置共享,新建配置文件:springcloud-actuator-common.yml,开启全部 actuator 端点:
management:
endpoints:
web:
exposure:
include: '*'
endpoint:
health:
show-details: always
基于避免重复造轮子的原则,也可以不需要增加 MeterRegistryCustomizer 配置类了,1.1.0+ 以后也支持在配置文件配置了,所以我们只需要增加一个 nacos 的 shared-configs 共享文件即可。如下:
management:
endpoints:
web:
exposure:
include: 'prometheus' # 暴露/actuator/prometheus
endpoint:
health:
show-details: always
metrics:
tags:
application: ${spring.application.name} # 暴露的数据中添加application label