Prometheus 监控注册 Nacos 注册的服务
Prometheus官方提供Consul为注册中心的配置方式且只支持Consul的接口,配置后可自动获取Consul中所有实例的信息并进行监控,这里使用 Nacos Consul Adapter 来让 Nacos 伪装成 Consul
在 Spring Cloud Gateway 引入jar包
可以是服务中任意的节点,在Spring Cloud Gateway中引入jar包的原因是它基于Reactor,如果不是使用Spring WebFlux则还需要引入额外的包。
1 | <dependency> |
如果拉取不到包,可以在setting文件中添加如下配置:
1 | <mirror> |
修改应用的依赖及配置
在 pom.xml 文件中添加相关的 Maven 依赖项,视情况调整相应的版本
1 | <dependency> |
修改代码,暴露指标接口
在项目启动时,添加相应的监控配置,同时 micrometer 也提供了部分常用的监控数据采集,具体在 io.micrometer.core.instrument.binder 包下,可以按实际情况添加。
姿势一:
1 | public class Application { |
由于 JVM GC Pause 监控是通过 GarbageCollector Notification 机制实现,因此只有发生 GC 之后才有监控数据。上述示例为了测试更直观,主动调用了
System.gc()。通过
http://localhost:8080/metrics访问到 Prometheus 协议的指标数据。
姿势二
1 |
|
在项目启动类加上这个bean配置之后,别忘记在配置文件加上management.endpoints.web.exposure.include=*这些配置来开启 Actuator 服务,因为Spring Boot Actuator 会自动配置一个 URL 为 /actuator/Prometheus 的 HTTP 服务来供 Prometheus 抓取数据,不过默认该服务是关闭的,该配置将打开所有的 Actuator 服务
完成之后,我们再启动服务,然后在浏览器访问http://192.168.0.4:6601/actuator/prometheus,就可以看到服务的一系列不同类型 metrics 信息
例如 http_server_requests_seconds_count、jvm_threads_states_threads、jvm_classes_loaded_classes、jvm_memory_max_bytes、jvm_gc_pause_seconds summary、jvm_gc_memory_promoted_bytes_total counter 等等。
Prometheus 配置
K8s 容器版
1 | apiVersion: monitoring.coreos.com/v1 |
二进制版
1 | - job_name: nacos-prometheus |
在 Prometheus 验证监控服务
1 | # 重启 prometheus 容器 |
配置 Grafana 并展示监控界面
此处使用模版ID:10280
还有很多不错的模版,比如说:4701,14370,8878…
可以参考:https://grafana.com/grafana/dashboards/
应用概况
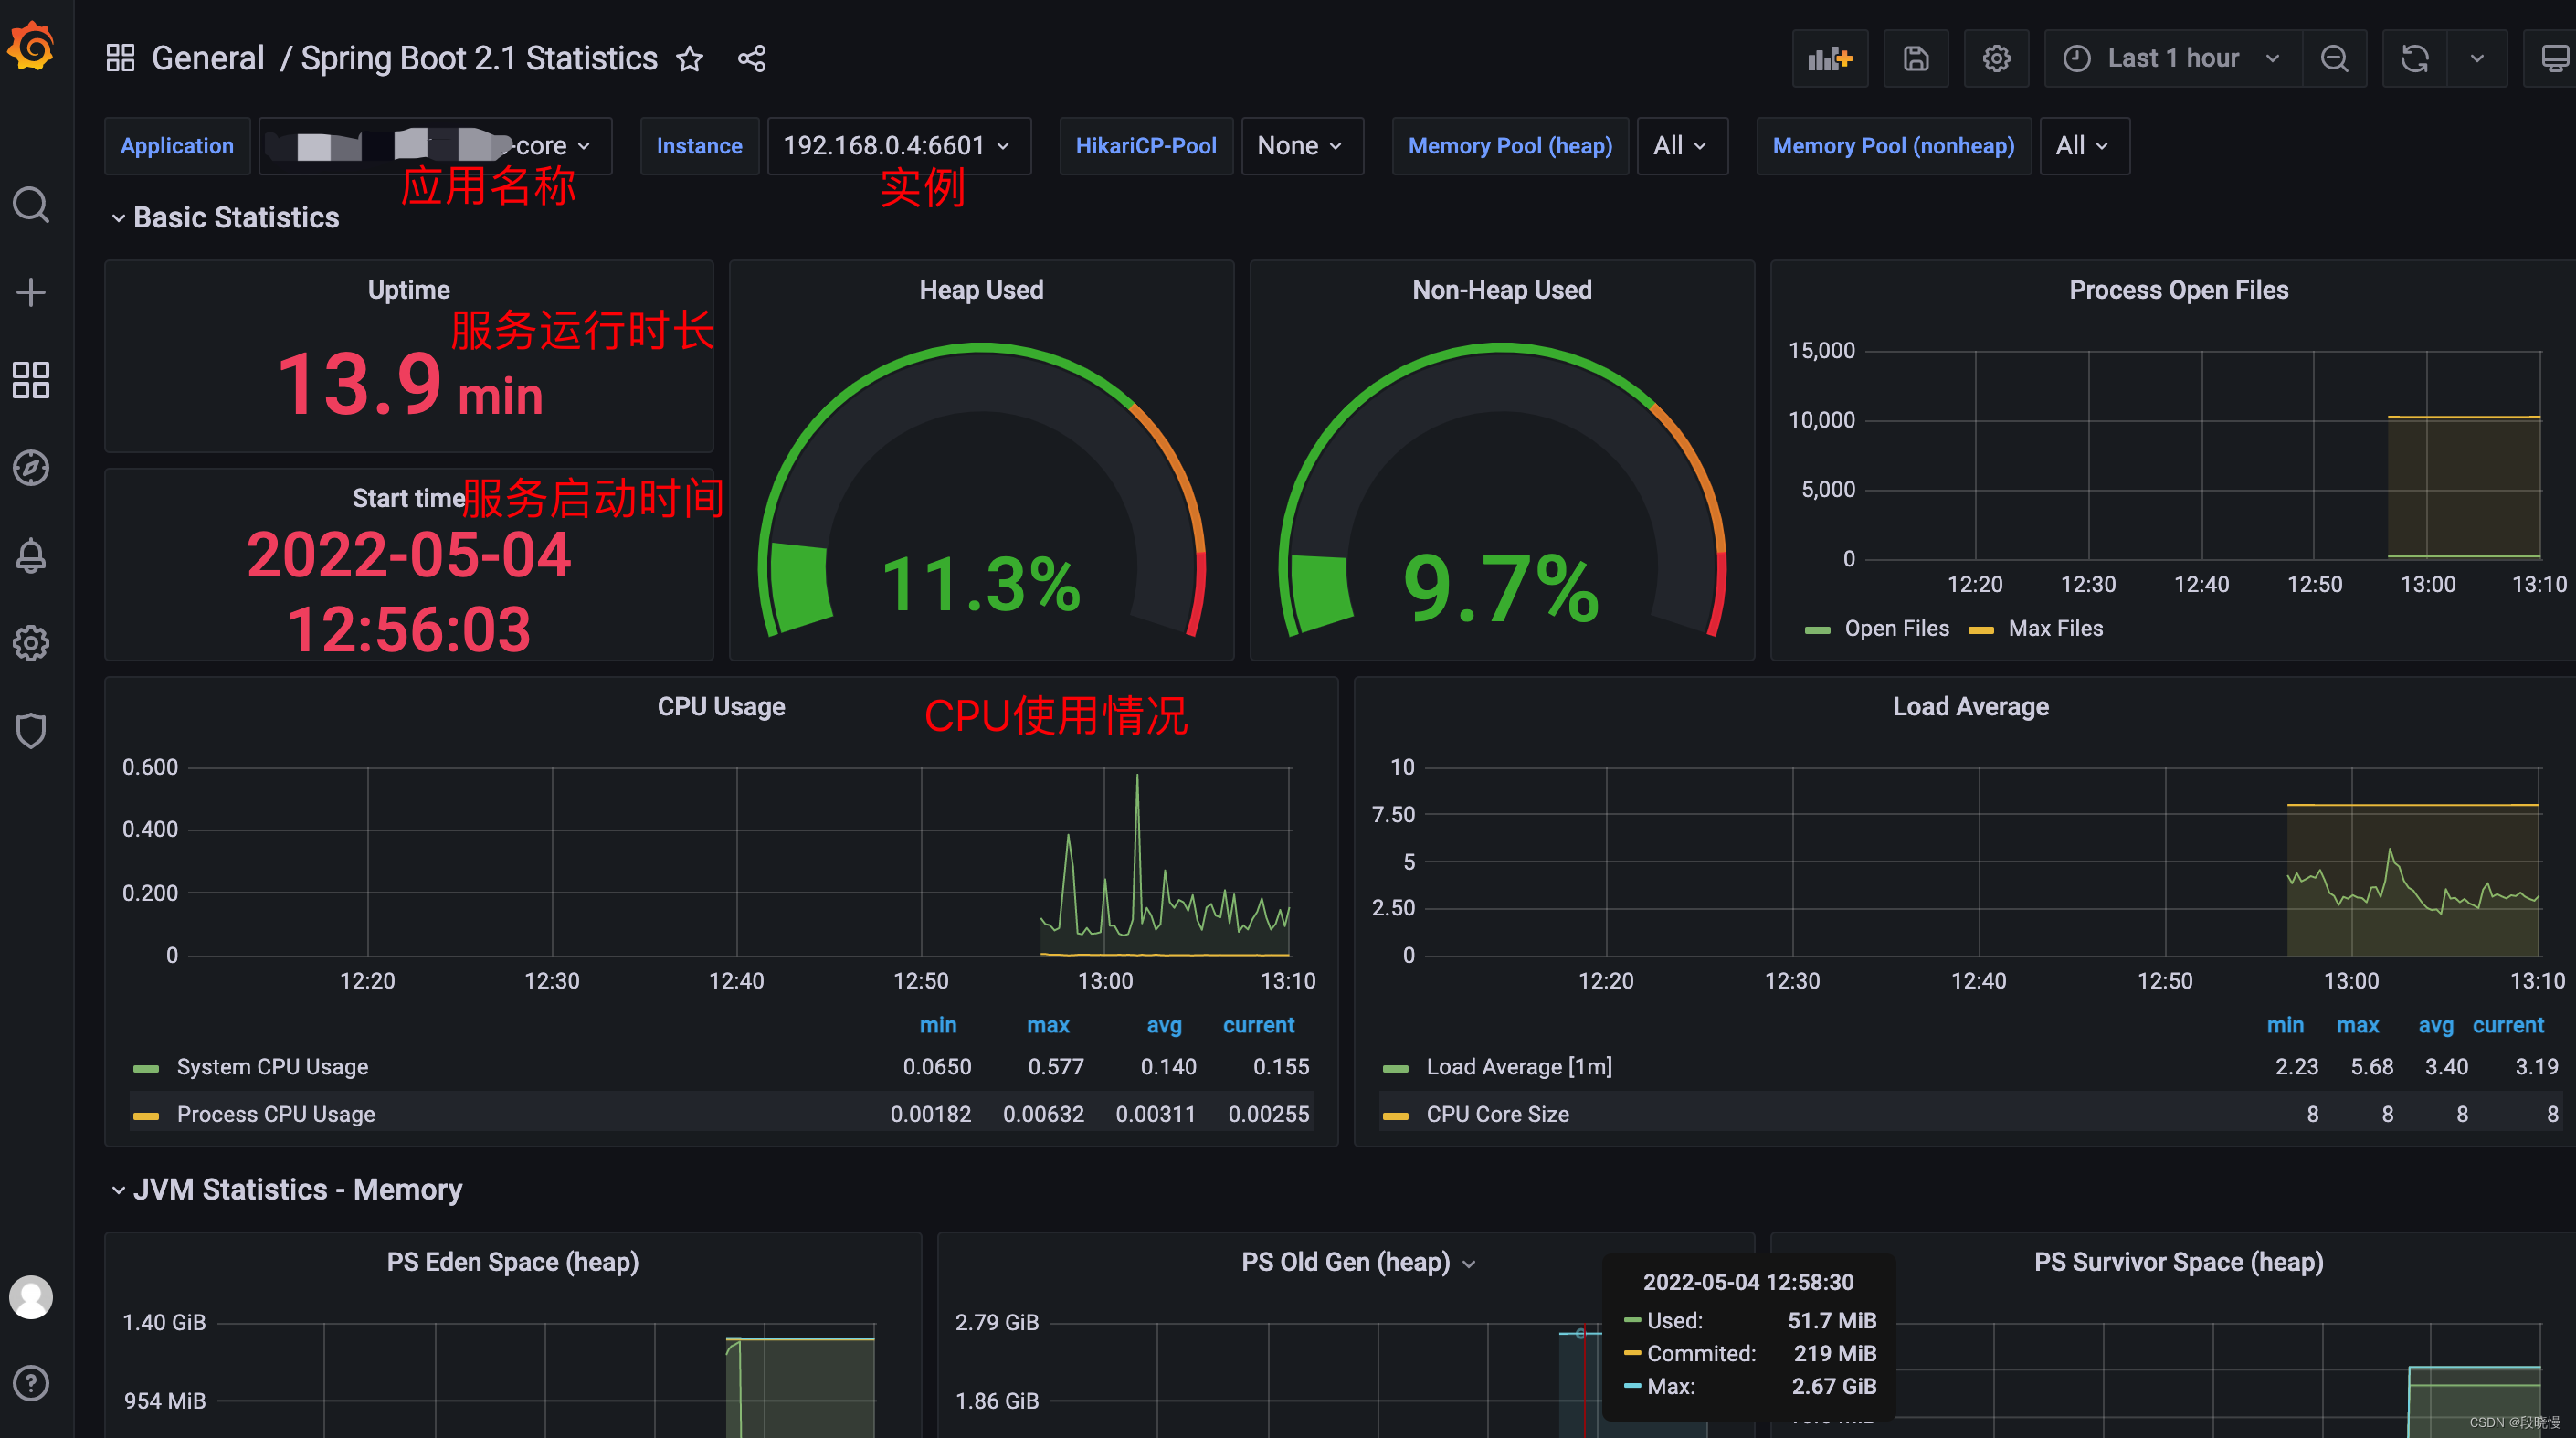
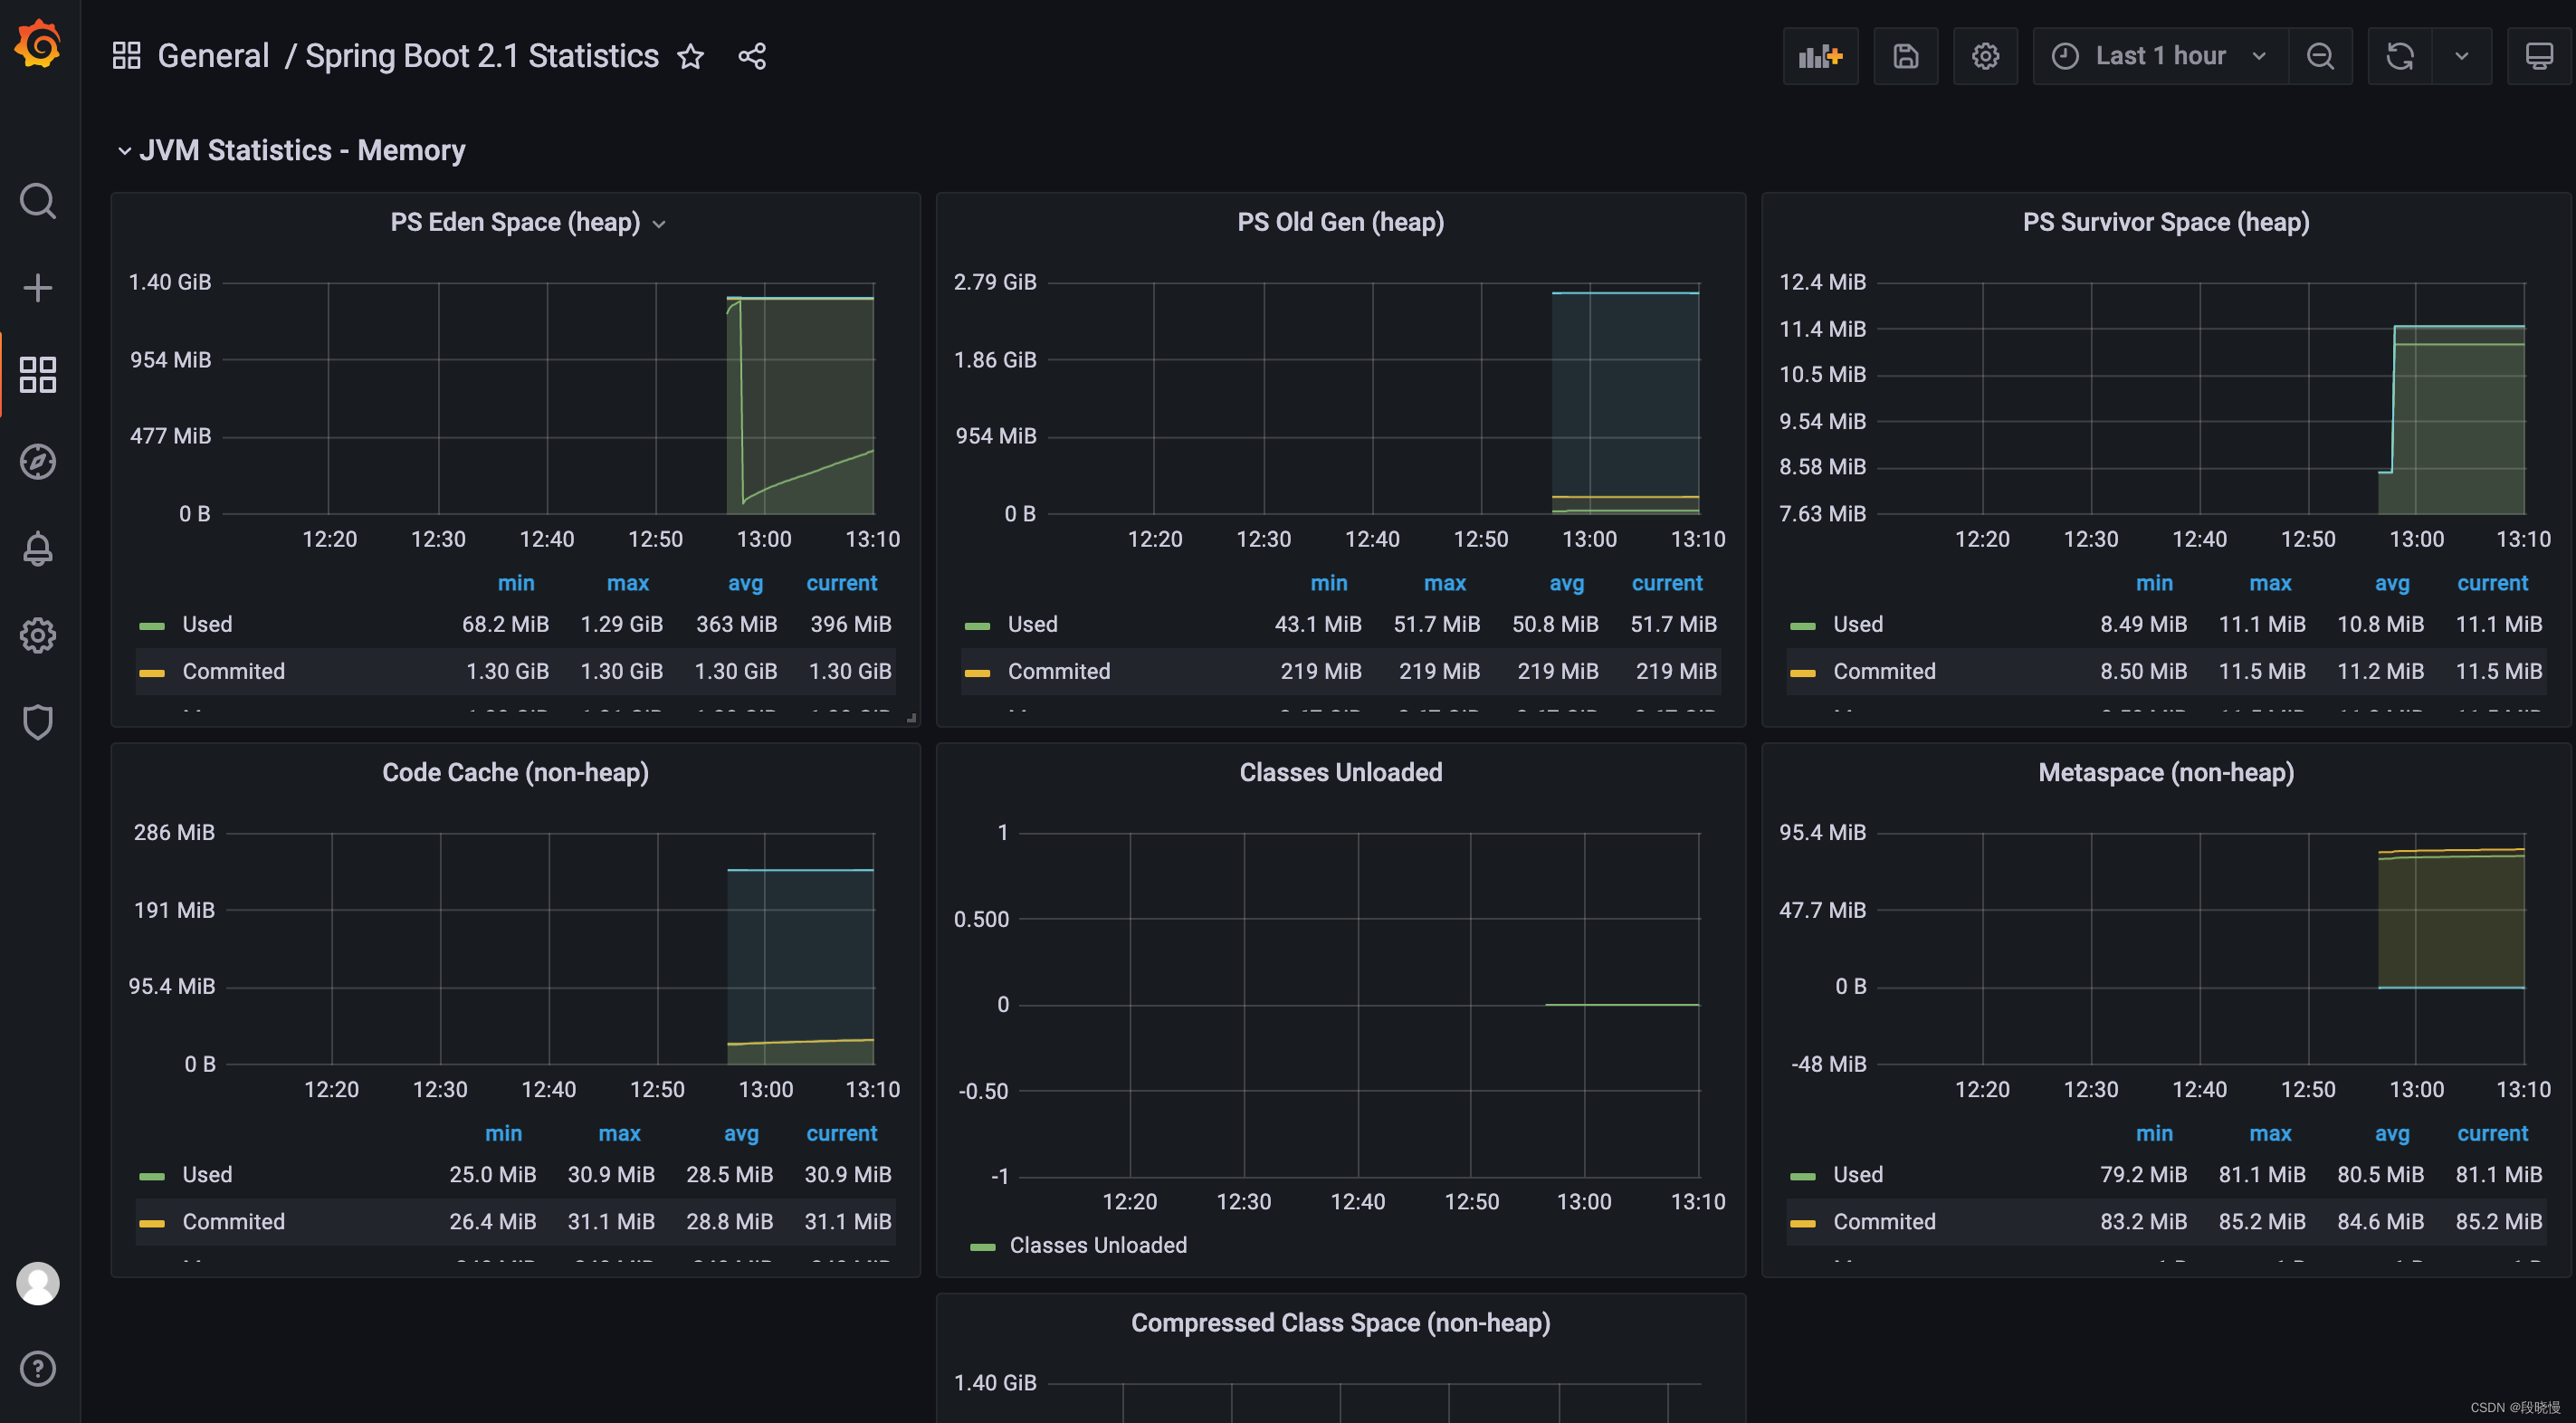
JVM 相关的监控数据
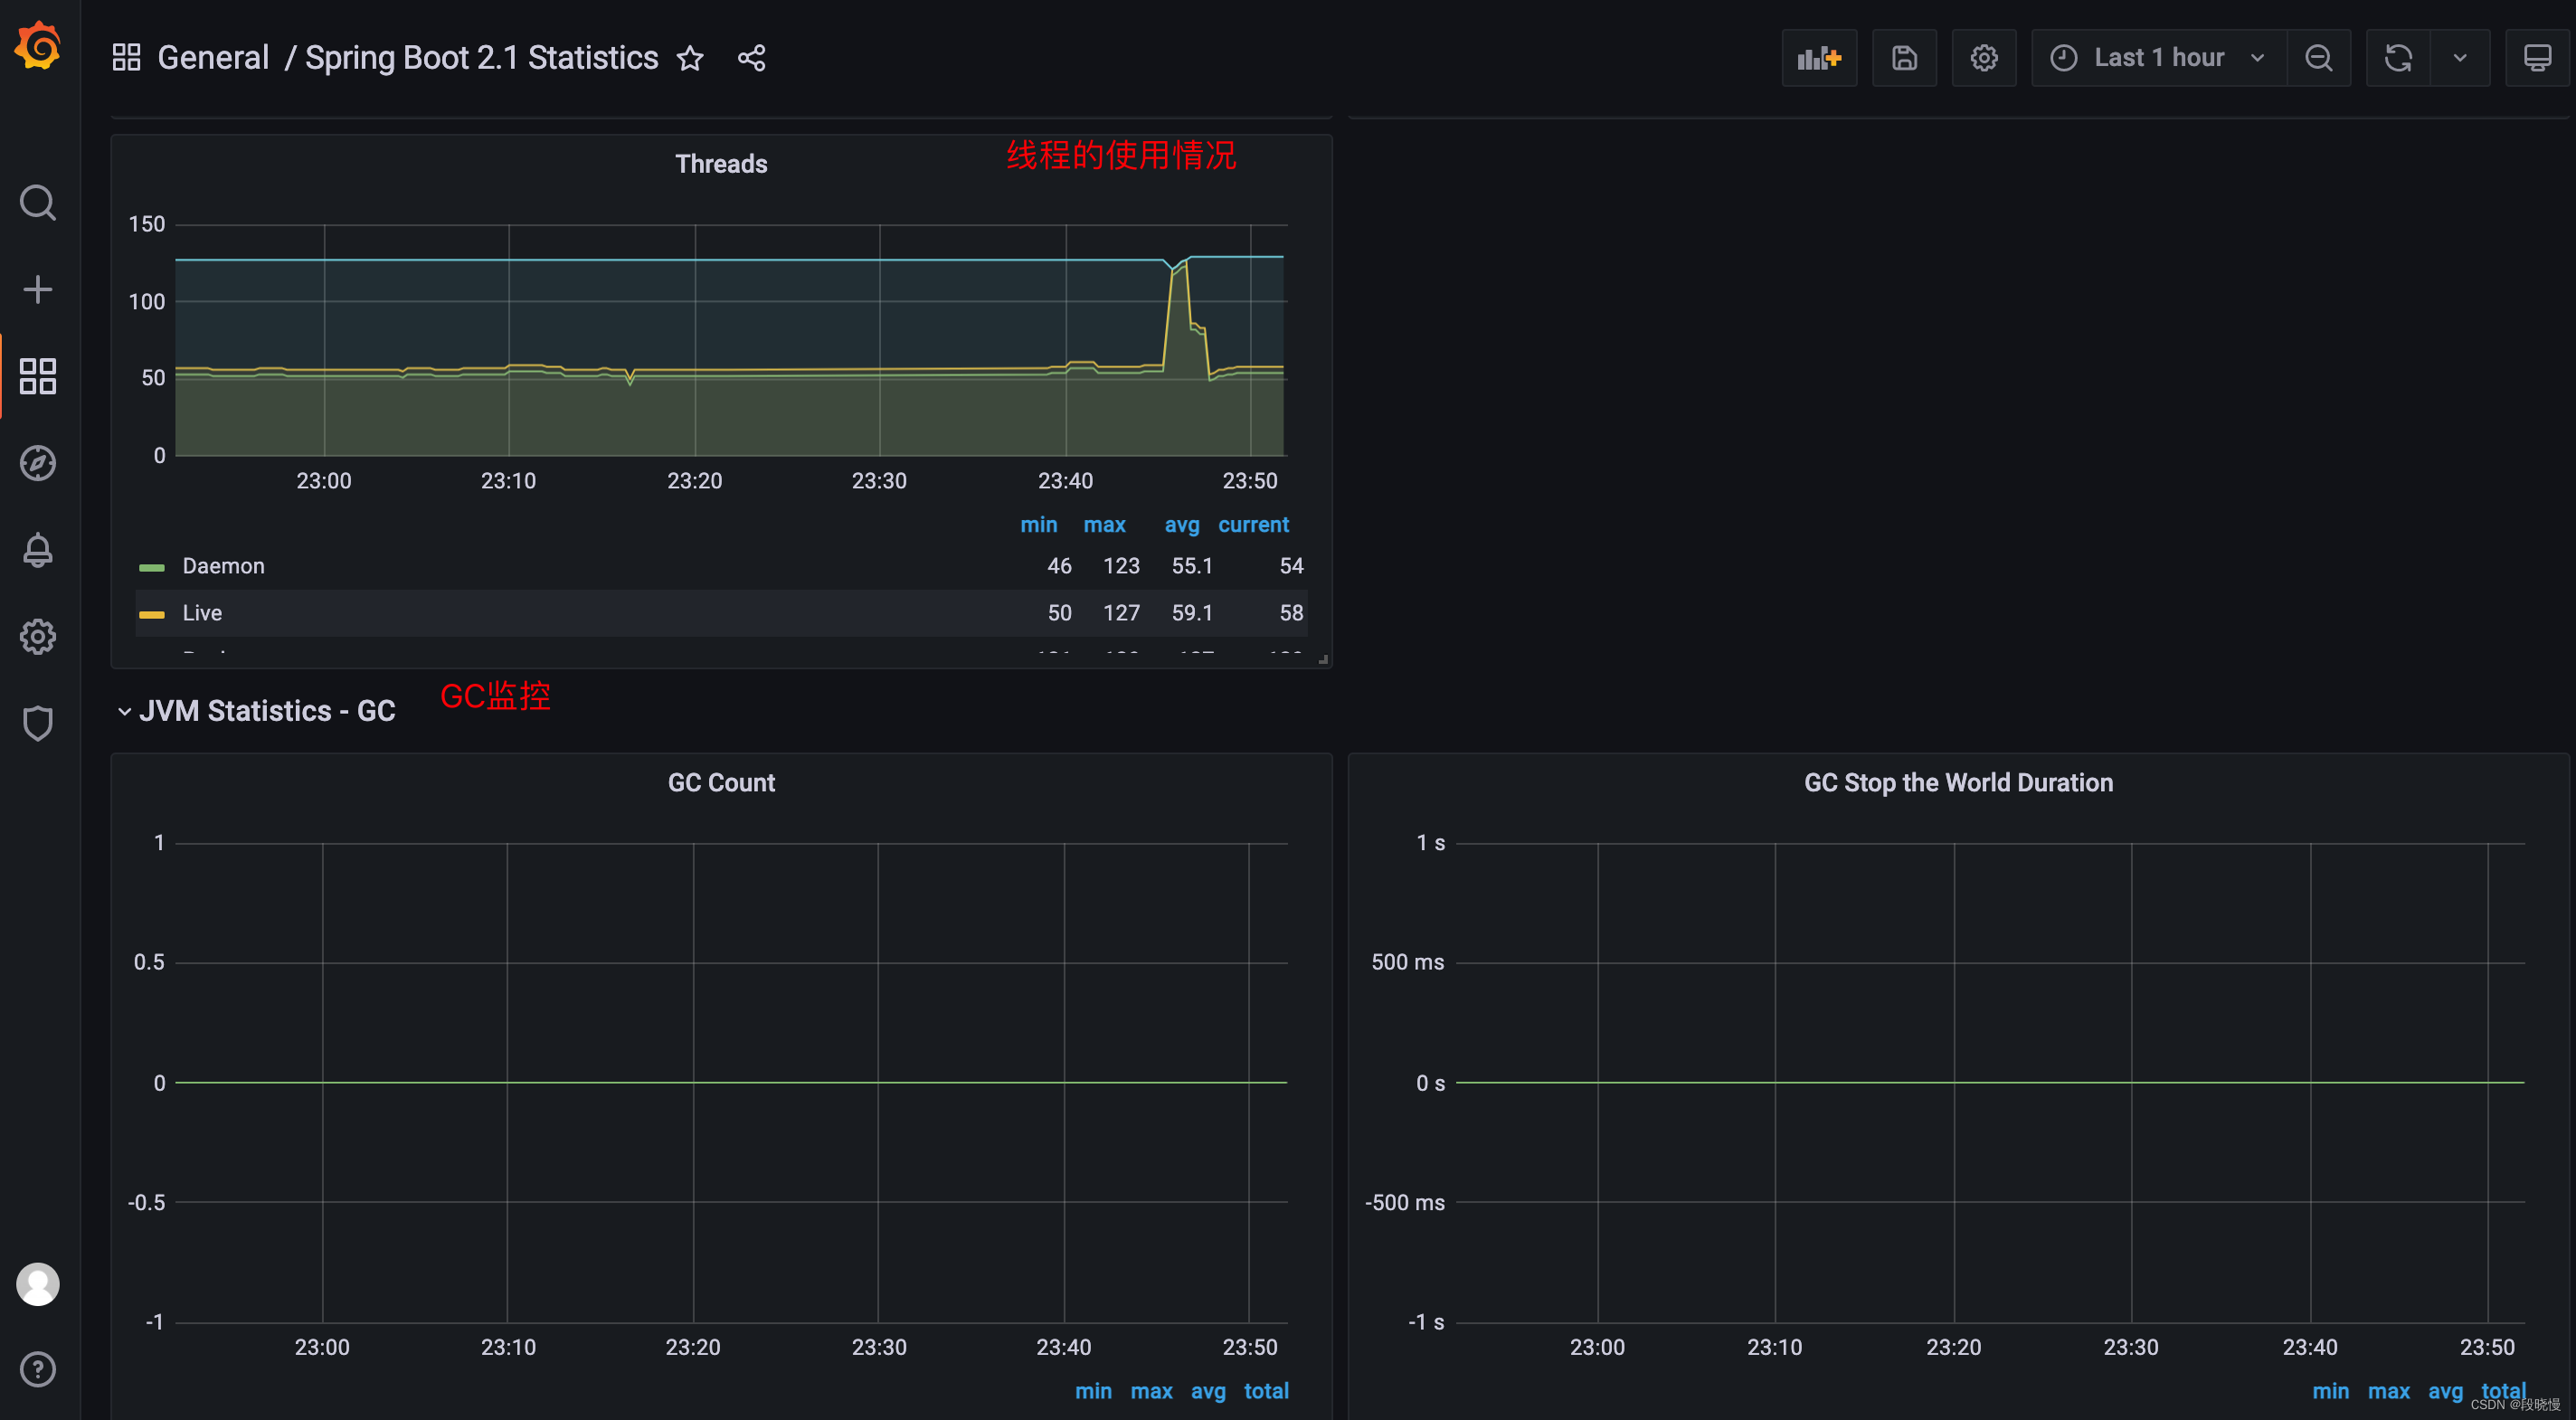
GC 情况
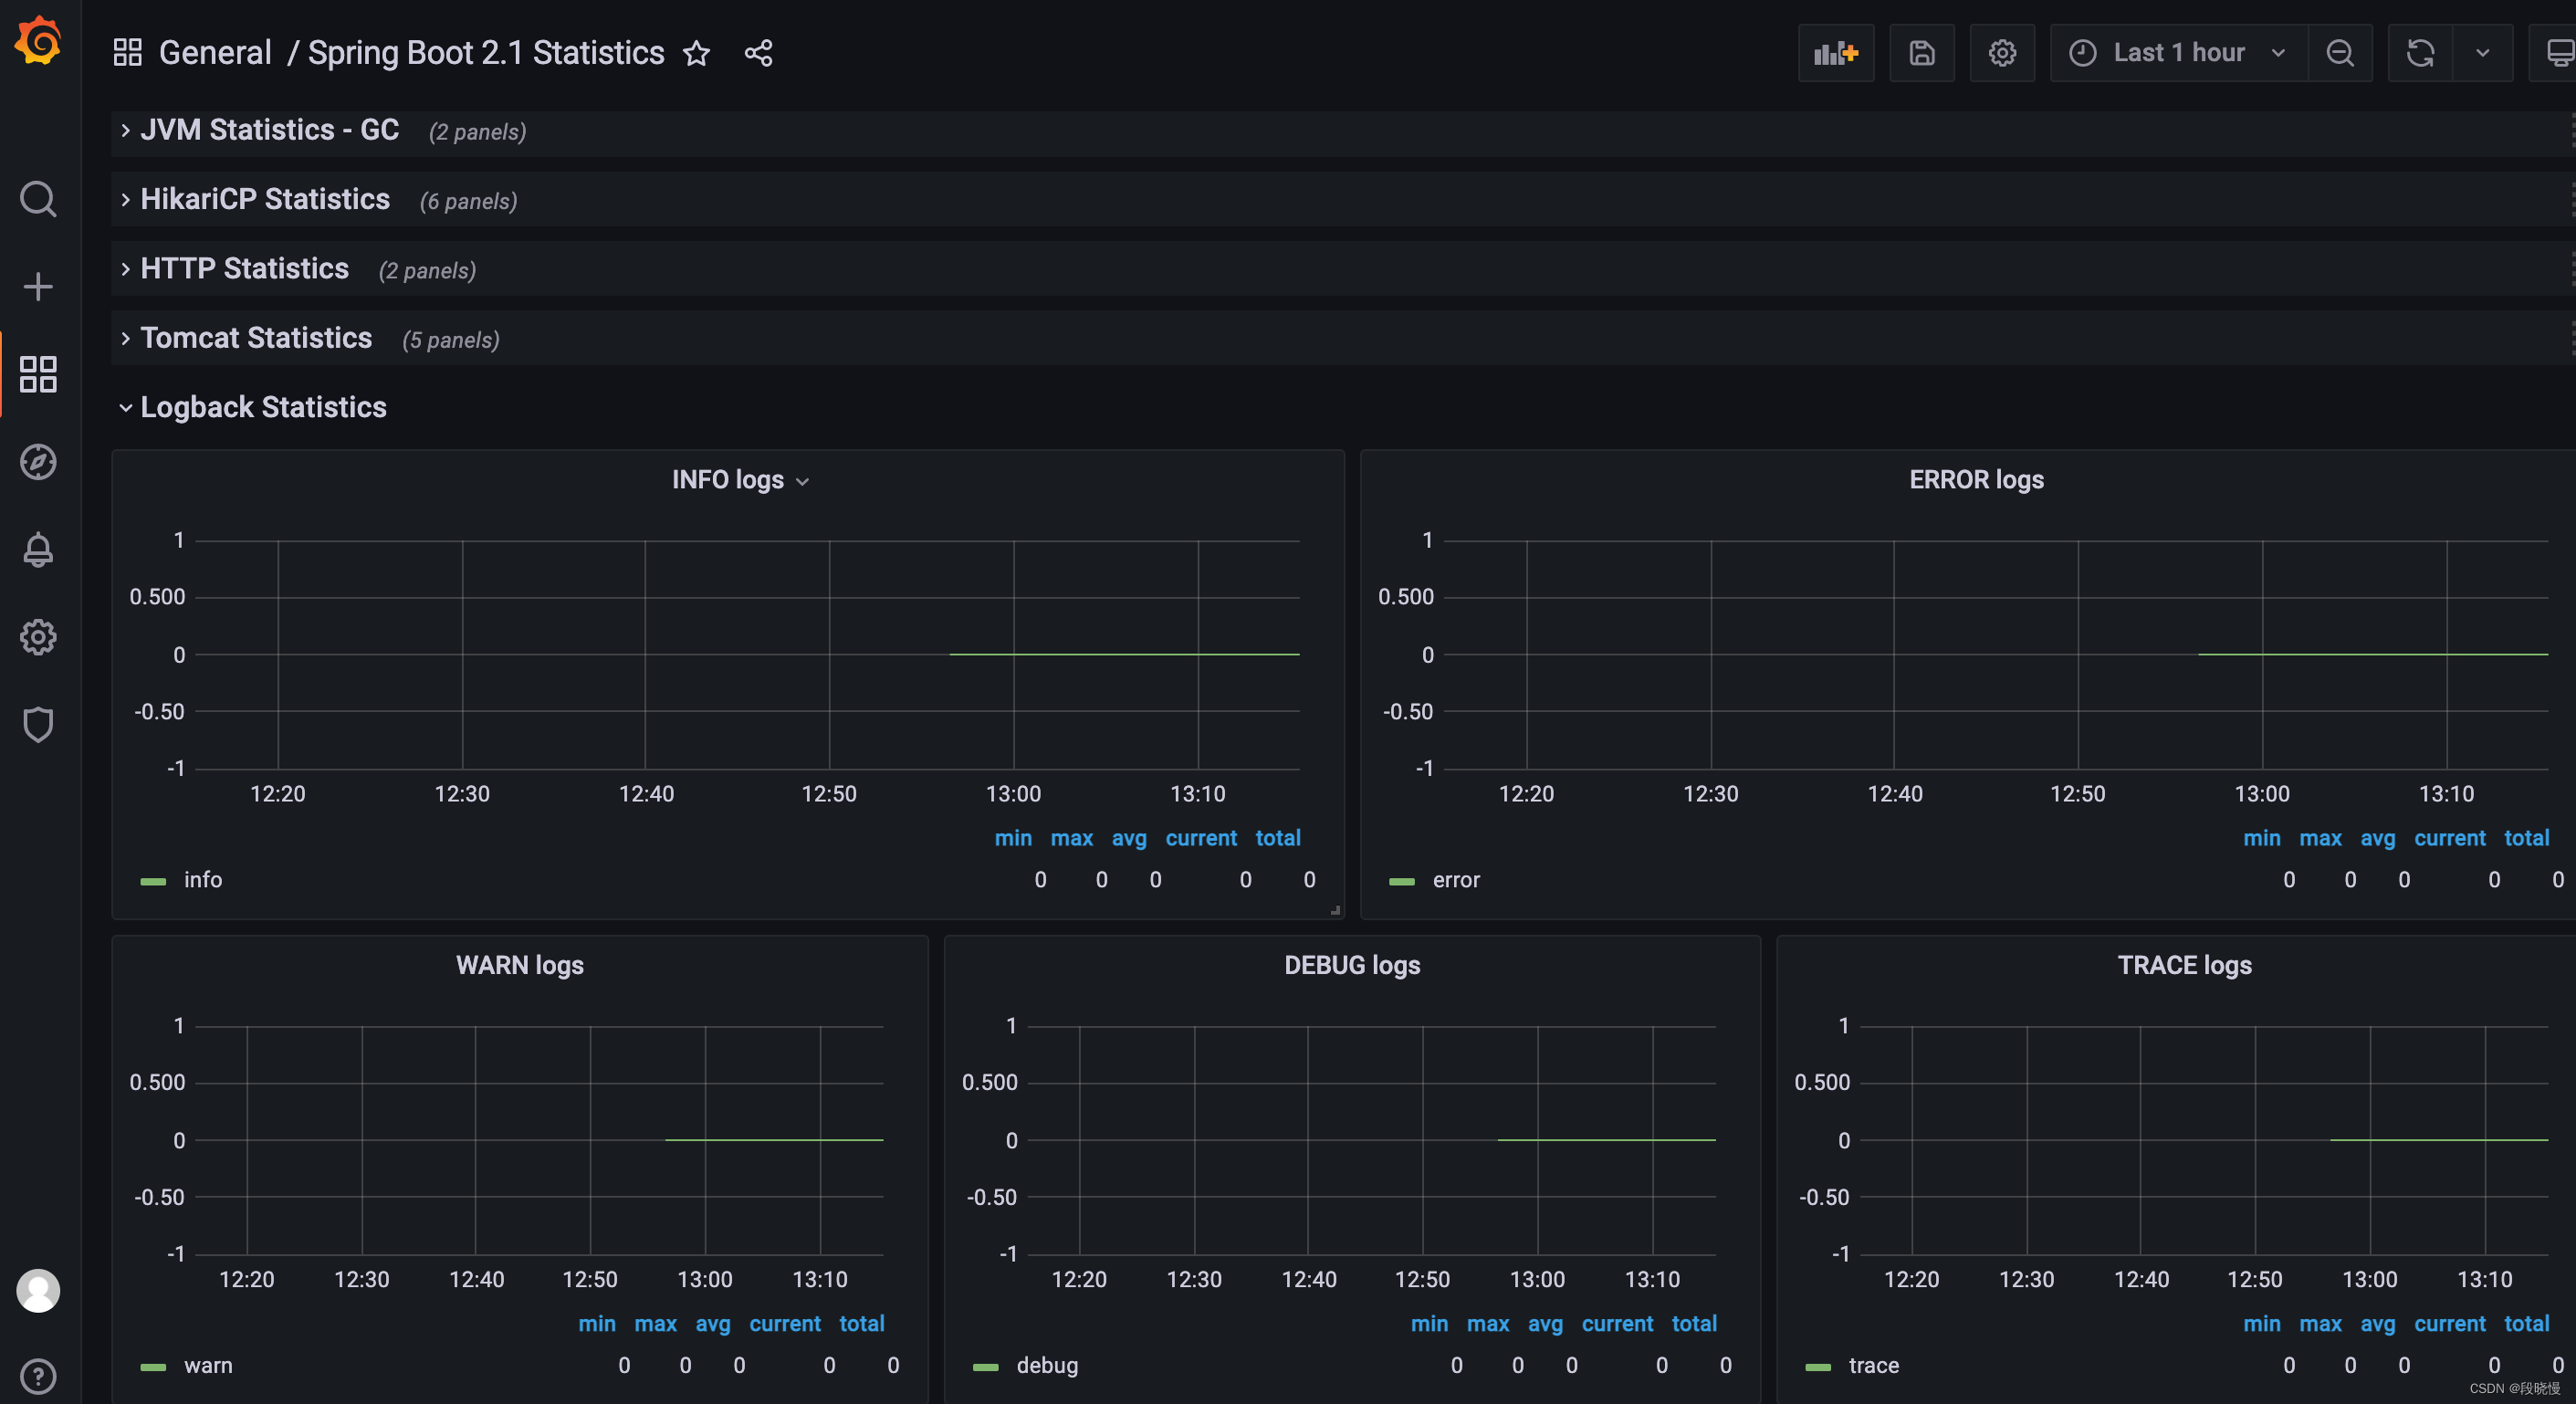
日志统计分析数据
自定义监控指标并展示在 Grafana
虽然 Spring-boot-actuator 集成了 Micrometer 来提供的默认监控项,覆盖 JVM 各个层间的监控,配合 Grafana Dashboard 模板基本可以满足我们日常对 Java 应用的监控,当然,它也支持自定义监控指标,实现各个方面的监控,例如统计访问某一个 API 接口的请求数,统计实时在线人数、统计实时接口响应时间等功能,而这些都可以通过使用 Micrometer 来实现
不对针对于接口的请求数和一些接口延迟,也可以使用 APM 来针对去做监控
举个例子:
监控所有API请求次数
监控请求次数可以使用 Counter 计数器来处理,为了测试,我们就直接在 Controller 类中进行累计,项目中,可以使用一个 AOP 切面,通过切面注入可以做到统计所有请求记录,代码:
2
3
4
5
6
7
8
9
10
11
12
13
14
15
16
17
18
19
20
21
22
23
24
25
26
27
28
29
30
31
32
33
34
public class GrafanaTestController {
private MeterRegistry meterRegistry;
private Counter counter;
public void init() {
Tags tags = Tags.of("common", "test");
// 公共标签
meterRegistry.config().commonTags(tags);
counter = Counter.builder("metrics.request.common").register(meterRegistry);
}
/**
* 订单请求测试
*/
public RestResponse<String> orderTest( String appId) {
counter.increment();
return RestResponse.ok(appId);
}
/**
* 商品请求测试
*/
public RestResponse<String> productTest( String appId) {
counter.increment();
return RestResponse.ok(appId);
}
}然后分别访问接口 /order/{appId} 6次,访问接口 /product/{appId} 6次,然后我们在 Grafana Dashboard 上添加一个新的 Panel 并添加 Query 查询,最后图形化展示出来
避免重复代码的更改操作
1.增加 MeterRegistryCustomizer 配置类,而不是在每个实例的启动类挨个配置;
1 |
|
2.使用 nacos 的 shared-configs 启用配置共享,新建配置文件:springcloud-actuator-common.yml,开启全部 actuator 端点:
1 | management: |
基于避免重复造轮子的原则,也可以不需要增加 MeterRegistryCustomizer 配置类了,1.1.0+ 以后也支持在配置文件配置了,所以我们只需要增加一个 nacos 的 shared-configs 共享文件即可。如下:
1 | management: |